| Short Term Bulls vs. Bears Scoring System | ||||
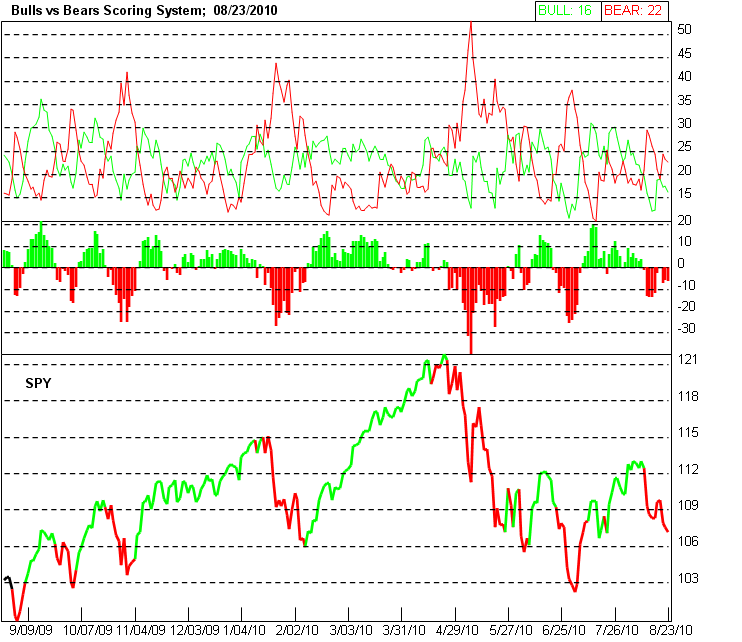 | ||||
| Short-term buy signal: Bulls>Bears and Bulls>=25; Sell signal: Bears>Bulls and Bears>=25 | Signal History | |||
| Comments: low volume mkt, hard to call the short term direction. | ||||
| Summary of S&P 500 Stocks Daily Price Change Behavior Model 8/23/2010 | ||||
| Type of Daily Move | # of Stocks | Percent of all stocks | Avg Move | Symbols of the Moves |
| UP over 2 STD | 0 | . | 0 | Click here to show stocks |
| UP between 1 to 2 STD | 15 | 3.01 | 1.23 | Click here to show stocks |
| UP between 0 to 1 STD | 151 | 30.26 | 0.31 | |
| DOWN between 0 to 1 STD | 278 | 55.71 | -0.47 | |
| DOWN between 1 to 2 STD | 51 | 10.22 | -1.25 | Click here to show stocks |
| DOWN over 2 STD | 4 | 0.8 | -2.2 | Click here to show stocks |
| Total # of UP Moves | 166 | 33.27 | 0.39 | |
| Total # of DOWN Moves | 333 | 66.73 | -0.61 | |
| Total | 499 | 100 | -0.28 | |
| Note: | ||||
| How to read this table | ||||
| Intermediate Term Market Mode | ||||
| Comments: | ||||
| Long Term ZigZag View of SPY | ||||
 | ||||
| Comments: | ||||


Guesstimates on June 9, 2026
10 hours ago